PerfChecker Studio in VS Code
PerfChecker combines Julia performance tests, saved results, plots and optional agent conversations inside VS Code. Studio opens as a full editor tab: keep it beside your source, move it into another editor group, or return to the compact PerfChecker views in the activity bar.
Follow this page for a first measurement and a version comparison. Continue with configuration, plots and Julia tools or MCP advice and implementation when you reach those steps.
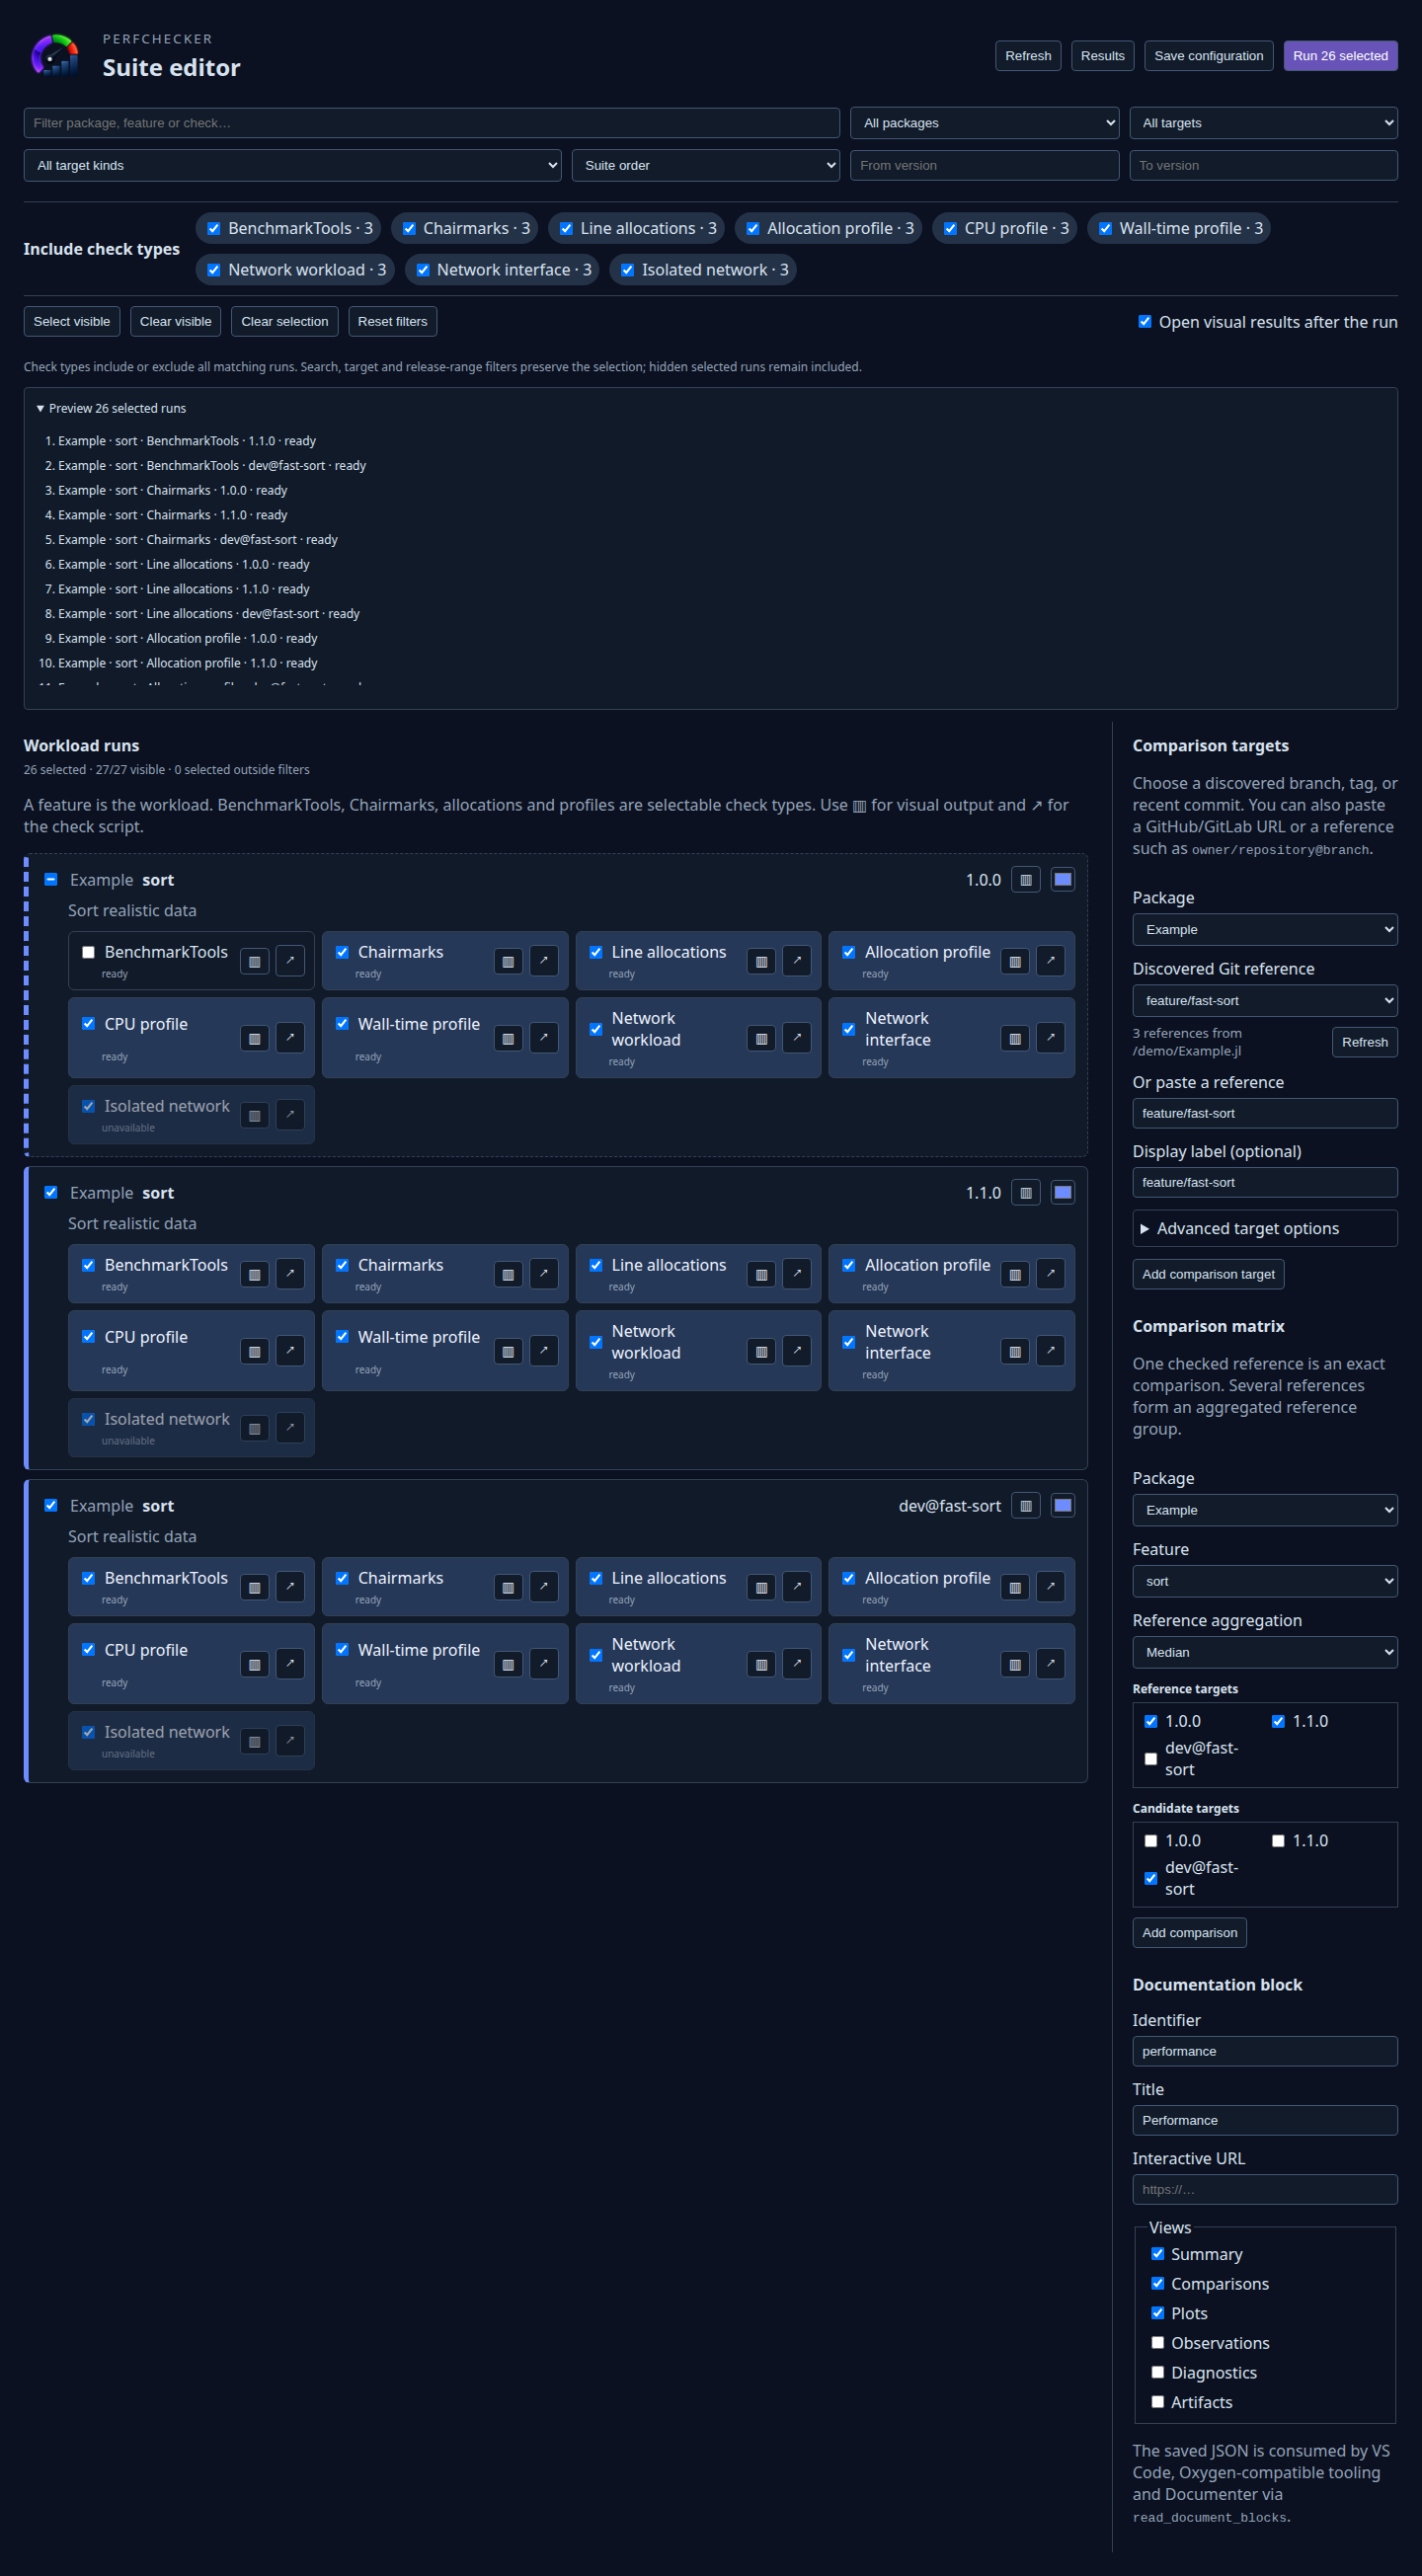
The screenshots below show the actual V1 extension webviews running in an isolated Chromium test harness, with demonstration projects and results. They are not drawings or screenshots of a complete VS Code window. In VS Code, the same webviews open in editor tabs; the surrounding editor and theme may differ. Select any screenshot to open its full-resolution image, including the form fields and implementation diff.
Install and prepare
Install VS Code 1.96 or newer and Julia 1.10 or newer.
Install PerfChecker from the Visual Studio Marketplace, or search the Extensions view for
@id:mirage-interactive-fr.perfchecker-vscode. You can also download the qualified V1 VSIX and use Extensions → … → Install from VSIX…. Reload VS Code if prompted. See VS Code's installation instructions for either route.Open the package folder. Trust the workspace when you are prepared to execute its Julia code.
Prepare a Julia controller environment containing the matching PerfChecker build and the collectors you intend to use. Existing TestItems also require TestItemRunner and the package's test dependencies.
Set PerfChecker: Runner Project (
perfchecker.runnerProject) to the controller environment. For shared scenarios, set Scenario Project (perfchecker.scenarioProject) to the environment containing the measured code and its dependencies.Run PerfChecker: Open Studio from the command palette. In a workspace with several folders, select the package to inspect.
The extension release notes identify the qualified artifact. PerfChecker's Julia registry release and its VS Code extension are distributed separately; installing the Julia package does not install the extension.
Opening Studio reads configuration and presents actions. It does not install packages, start Julia, download a model or launch an agent. A controller should contain HTTP if you enable MCP. JET and other analyzers belong in the environment selected for their workers.
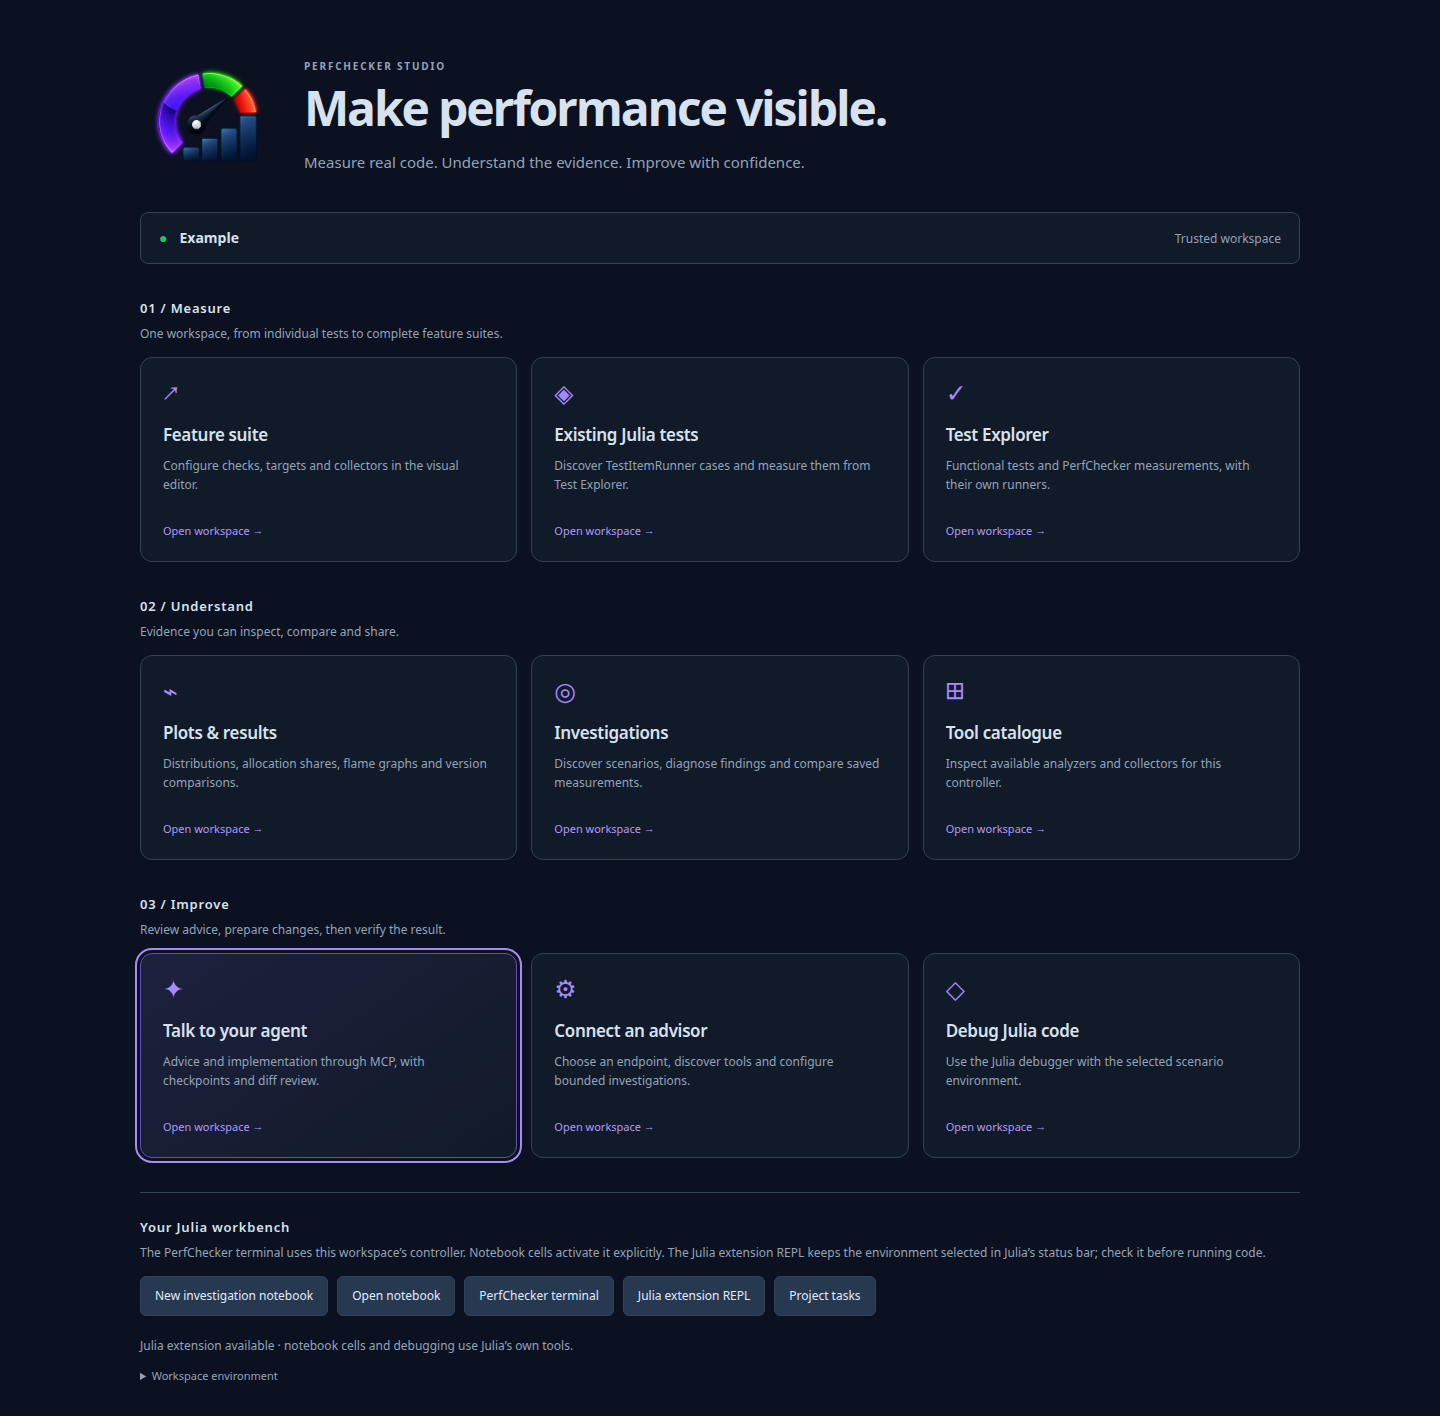
If this is your first setup, follow Prepare a controller before running an item. Use the dedicated controller so adding a profiler or MCP client does not change your package's normal dependency environment.
See Installation for the core and interface packages, and VS Code configuration for complete settings and environment examples.
Get a first result
For a project using @testitem:
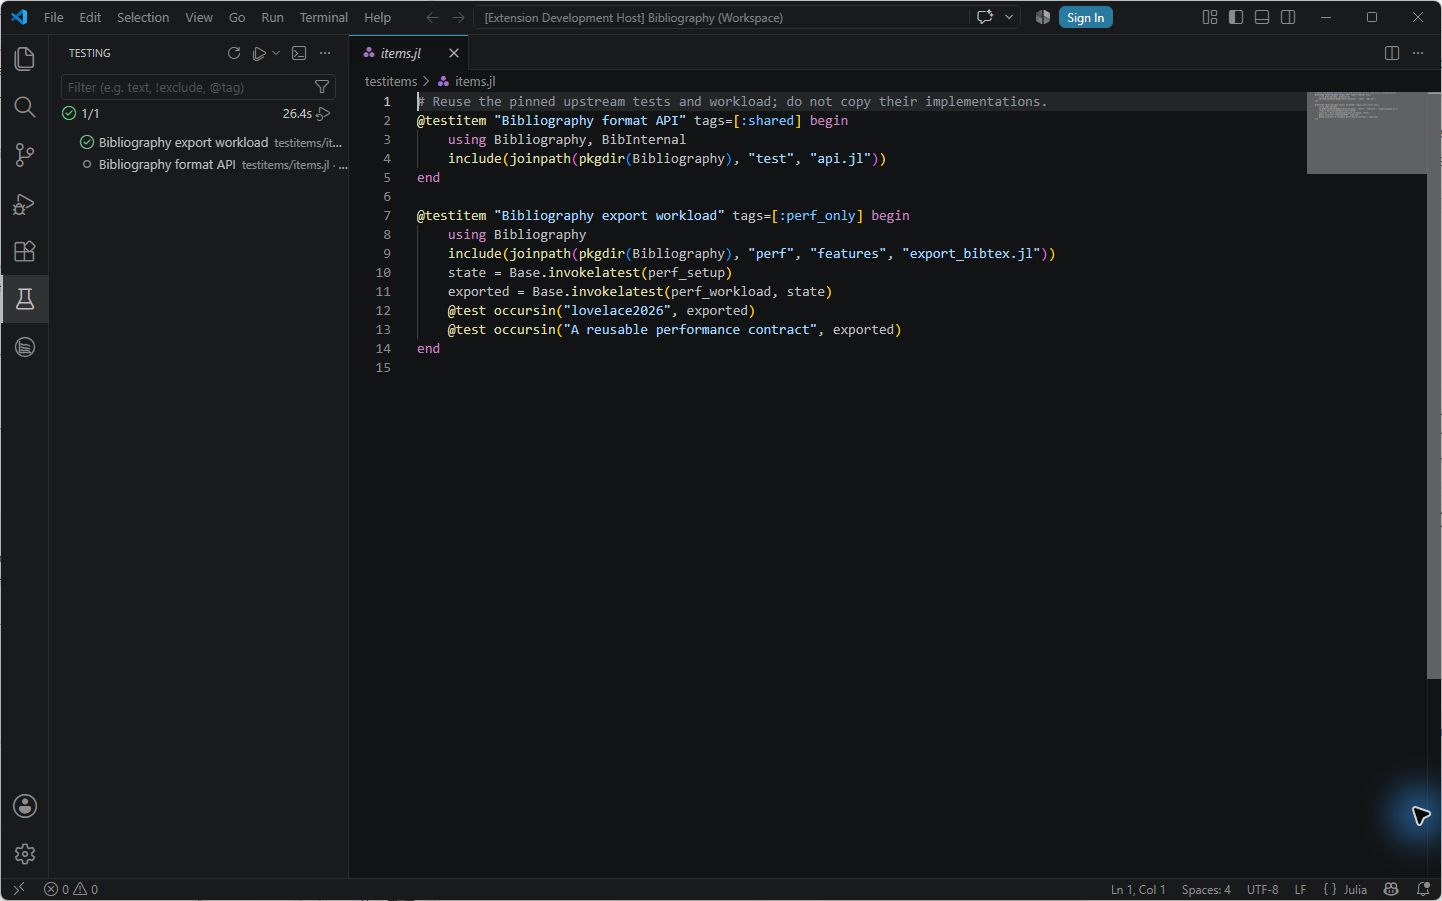
Studio → Existing Julia tests, or command palette → PerfChecker: Discover existing test items.
Open VS Code's Testing view and expand the PerfChecker controller named for your selected folder.
Select one item and run it. PerfChecker measures the selected item in a fresh worker.
Inspect the item's Testing output for measured milliseconds, sample count and correctness. The summary includes setup and assertions; it does not compare a performance budget.
Open View → Output and select PerfChecker test items. Follow the
Evidence:file path to inspect the JSON report's item validation and each sample'sseconds,bytesandcorrectness.
If your package has no test items yet, add a small correctness-checked example to test/performance.jl:
using TestItems

@testitem "Vector reduction" tags = [:performance] begin
    data = collect(1:10_000)
    @test sum(data) == 50_005_000
end
Save the file, discover again and select Vector reduction. The item measures its setup and assertion as well as the reduction; use a shared scenario when you want prepared inputs outside the measurement. The ordinary performance tag is an example filter, not a required or special tag. The package must have TestItems available for its test declarations.
The Testing session's elapsed time can include worker startup. Each item's reported measured duration has its own boundary. A green functional test does not establish a performance budget. Use TestItems and tags to distinguish shared, functional-only and performance-only items.
Native TestItem JSON is a separate result from a suite report. The extension's Open visual output reads saved suite measurements; prepare and run a suite for the distribution, profile and version-series workflow below.
For a suite, use PerfChecker: Create feature suite if you need a starter, or configure your existing perf/suite.jl. Studio → Feature suite opens the full visual editor. Select a workload, checks and a target, run that selection, then open the resulting report.
Work across the full editor
| Surface | Purpose |
|---|---|
| Studio | Start the workflow, inspect the selected project and open the next action |
| Suite designer | Choose features, checks, targets and comparisons |
| Testing view | Discover and run existing Julia TestItems |
| Visual output | Inspect saved distributions, allocations, flame graphs and version comparisons |
| Investigations | Discover scenarios, measure, diagnose and read deterministic advice |
| Advisor chat | Discuss saved evidence; explicitly request implementation and review its diff |
| Julia notebook | Run an editable discovery → measurement → diagnosis workflow |
| PerfChecker terminal | Use a dedicated Julia session in the controller project |
These are VS Code editor tabs and native surfaces. Arrange them with VS Code's editor groups; the activity bar is an entry point, not the available working area.
Design a suite and compare targets
The suite editor supports global and per-feature check selection, version ranges, filtering, sorting and ordering. Name targets for a branch, tag, commit, working tree or release, then choose exact or grouped baselines. Grouped references can use median, mean, minimum or maximum aggregation.
Save the selection with Save configuration in the suite editor. The default is perf/perfchecker-ui.json; compatible web and documentation interfaces can read the same configuration. In extension 1.0.0, the separate command-palette action PerfChecker: Save shared UI configuration has a confirmed defect; use the editor button while its correction is being prepared. Running the selection shows progress and leaves saved evidence for later review.
The editor separates filtering from selection. Search, package/target filters and release bounds change what is visible without deselecting hidden runs. Select visible and Clear visible act on the current filter; Clear selection affects the entire selection. The counter reports selected runs, visible runs and selected runs outside the filter. Run N selected includes those hidden selections, so review the exact identifier preview before execution. Show more pages workload groups without restricting bulk selection.
Collector toggles select or deselect matching runs. Unavailable conditions show their reason. Add targets from discovered branches, tags and recent commits or enter a supported ref/URL, then inspect the comparison matrix. Missing or overlapping references are reported before a run; refreshing the plan preserves existing selections when their identifiers still exist.
Choose the evidence for your question
| Question | Start with | Read before selecting |
|---|---|---|
| Did this operation become slower? | benchmark or chairmark | Samples, time units, prepared inputs and the same collector for both targets |
| Which call path uses CPU time? | profile | Stack sample weights; an empty capture does not prove zero cost |
| Where do allocations occur? | profile_alloc or alloc | Sampling/source-line scope and measured totals |
| Why does waiting dominate? | wall_profile | Requires Julia 1.12 or newer; task stacks include waits |
| How much traffic does the operation generate? | A network collector | Reported counters, shared interface or isolated namespace have different attribution |
The designer shows combinations made available by your suite and environment; it does not install a missing collector. See Collectors for every supported check and its interpretation.
Compare a working change with a known revision
Prepare a suite containing the same workload for both targets.
Add a named baseline from a branch, tag or recent commit. Prefer a full commit identifier when you need an unambiguous recorded reference.
Add the candidate working tree or another supported revision, and inspect the plan's resolved target information. A Git target is a version of the measured package;
juliaExecutableseparately chooses the Julia runtime.Choose an exact baseline for a simple before/after comparison. Use grouped references only when their aggregation answers your question.
Select the same checks and inputs for both targets. Inspect selected runs, including any hidden by filters, then run the selection.
Open both saved reports and inspect correctness, comparison compatibility and the observations. Retain the baseline until the candidate is validated.
Changing a branch name or editor selection does not manufacture a compatible baseline. The saved evidence records the actual measured configuration.
The suite tree follows:
package → feature → check type → targetRead Suites and comparisons before interpreting a result across environments or machines. Never infer an improvement from a profile weight alone.
Investigate and verify
Use PerfChecker: Open investigations for shared scenarios. Discover scenarios from tests inspects declarations and proposes candidates without executing the target program. Proposed candidates need an explicit factory and correctness oracle before they become measurable cases.
Measure declared cases, diagnose with available analyzers, and choose Advise from saved evidence. Missing analyzers appear as unavailable; they are not installed automatically. After a change, rerun the same correctness checks and compare compatible before/after measurements.
Run bounded investigation can select declared experiments within count and time budgets. Optional model selection requires structured MCP replies and advisorInvestigates = true; it remains separate from implementation chat.
Cancel a run and wait for cleanup
Use Cancel in a suite execution notification, the suite Testing profile, an investigation or a native Testing run. PerfChecker asks the Julia controller to interrupt its current task and finish its cleanup. Accepting that request does not mean cleanup has finished: wait for the final run status. Closing a suite or investigation editor also requests cancellation. A new run stays blocked until the previous controller has closed.
A clean interruption finishes as cancelled. If cleanup fails, the run finishes as failed; PerfChecker: Show worker output contains the cause and any retained private inventory directory. See allocation cleanup before handling leftover traces or recovering an inventory.
The extension allows 60 seconds for the controller to finish. If that deadline expires, it forces the controller to stop and displays a warning that cleanup was not confirmed. Detached workers, allocation traces or inventories may remain. Closing VS Code forcibly, an operating-system shutdown or repeated interruption can also prevent cleanup; restarting the extension does not delete old .mem files indiscriminately.
Cancelling advisor chat or an MCP request stops the local conversation. A remote server or agent may continue working after the local request closes. Review the isolated implementation checkout and checkpoint before applying changes; local cancellation does not prove the remote tool stopped.
Advice and explicit implementation
Studio → Talk to your agent opens PerfChecker: Chat with performance advisor. For an authenticated native Codex CLI, choose Connect Codex CLI: the extension checks the installation and starts a temporary local MCP connector with separate advice and implementation tools. Follow the qualified Codex recipe, or configure an external MCP advice tool. Choose saved evidence if useful, then ask a question. Chat also works without evidence for configuration and usage questions; the agent is told no measurements were attached.
Review the answer. You can apply the advice yourself, or explicitly select Prepare implementation from reviewed advice. The latter requires the connected Codex implementation tool or a separately configured external tool, and a Git repository with an existing commit.
Before sending implementation, the extension warns that generated changes may be incorrect. It saves a Git checkpoint of the current on-disk state and prepares an isolated temporary checkout. The agent works there; the original working tree receives no proposed changes until you inspect the diff and select Apply reviewed implementation changes. Restore implementation checkpoint reverses that applied patch when the repository has not drifted.
Read the MCP guide for configuration, what is transmitted, checkpoint recovery, cancellation and the filesystem-access requirements of the agent tool.
Julia, notebooks and terminals
PerfChecker: Open Julia terminal creates a terminal named for the package and starts the selected Julia executable with the controller project. New investigation notebook opens an untitled Julia notebook containing explicit discovery, measurement and diagnosis cells. It is yours to edit and save; select an available Julia kernel.
PerfChecker: Debug current Julia file delegates a saved Julia source file to the installed Julia VS Code debugger. Debugging needs julialang.language-julia. The debugger and notebook kernel are separate from isolated measurement workers; stepping through a program is not a performance measurement.
See Plots, notebooks and Julia tools for supported displays, notebook prerequisites and a practical debugging sequence.
Companion and 3D integrations
A companion extension can open Studio for an explicit workspace URI using perfchecker.openStudioForWorkspace. Existing suite-editor and live-landscape integration commands remain available. They select the requested package folder rather than silently using the first folder in a multi-root workspace.
This provides the workspace boundary used by the Etendu/Beautiful Landscape integration. PerfChecker does not implement a new 3D renderer; the companion owns its scene and live graphics workflow. Verify its supported extension versions and selected folder before starting a run. Plots, notebooks and Julia tools describes the command contract.
Resolve common problems
| Symptom | Check |
|---|---|
| Studio command missing | Installed extension is the current stable version; reload the extension host |
| Worker cannot import PerfChecker | Runner Project contains the matching package and a Project.toml |
| Analyzer unavailable | Scenario Project contains that analyzer and its target dependencies |
| No plots | A completed saved report contains the relevant observations/profile artifacts |
| Chat refuses the configuration | Protocol is mcp_http, response is text, and an advice tool is selected |
| Implementation cannot proceed | A separate tool is configured; Git/HEAD exists; all buffers are saved |
| Wrong folder in multi-root workspace | Reopen Studio and select the intended package |
Use PerfChecker: Show worker output for execution diagnostics. See configuration troubleshooting and the MCP failure table for the next checks.
Recorded example