Collectors
A check type selects how a workload is measured. Each runs in an isolated worker with the chosen collector.
Use a benchmark to decide whether a regression exists.
Use a profile to find where the cost moved.
Use network collectors for traffic, with attention to attribution.
Benchmarks
:benchmark (BenchmarkTools)
Elapsed time, GC time, allocated bytes and allocation count. The default choice.
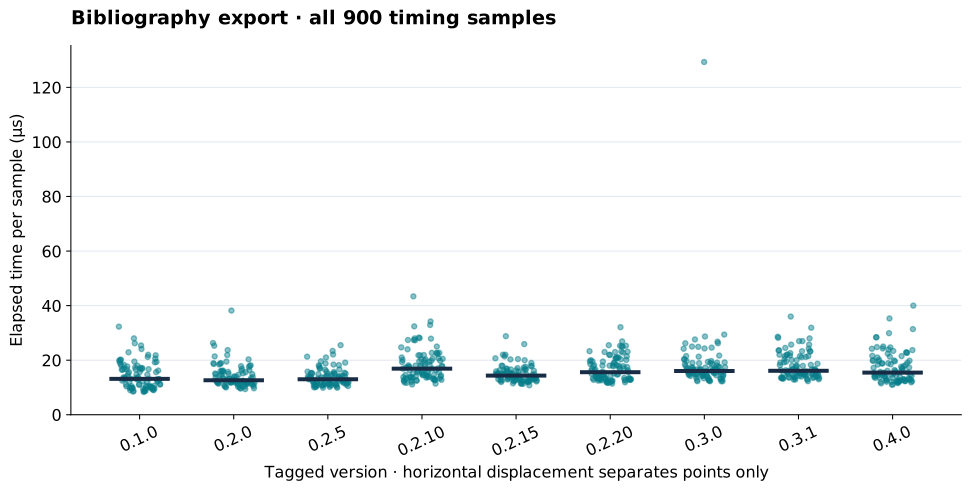
Inspect the distribution, not only the median.
Preparation outside the measured expression is excluded.
Requires BenchmarkTools.
:chairmark (Chairmarks)
The same quantities as a low-overhead alternative for short measurements.
Time is in seconds; GC is a fraction of elapsed time, not seconds.
Do not merge BenchmarkTools and Chairmarks samples into one distribution.
Profiles
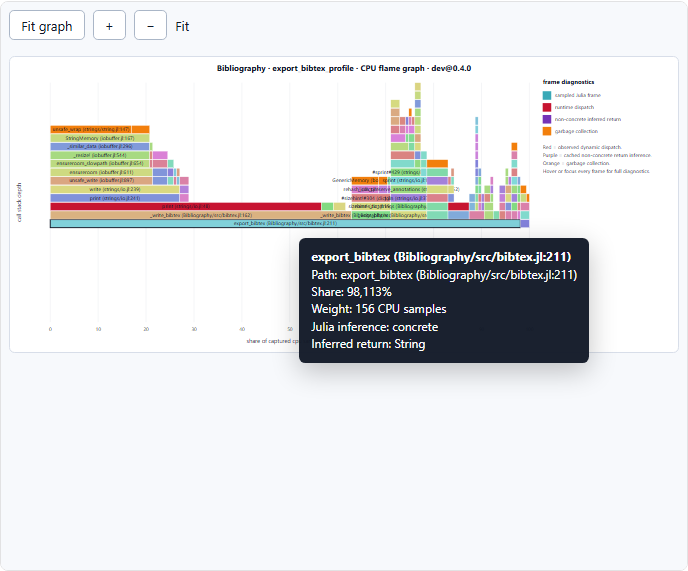
:profile — CPU samples
Sampling profiler call stacks. A sample is not a call count.
Follow a wide branch into its callees and inspect the source.
An empty capture is missing evidence, not a zero-cost function.
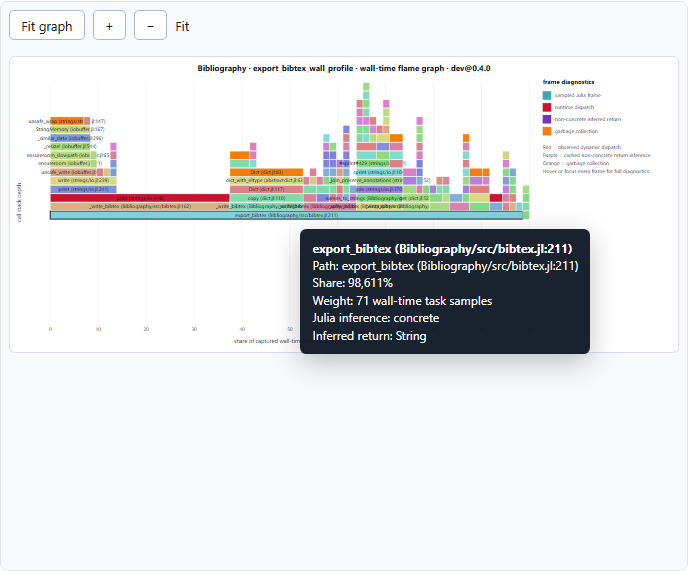
:wall_profile — task wall-time samples
Captures task stacks, including tasks that are waiting. Requires Julia 1.12 or later.
- Use it when elapsed time is high but CPU samples do not explain it.
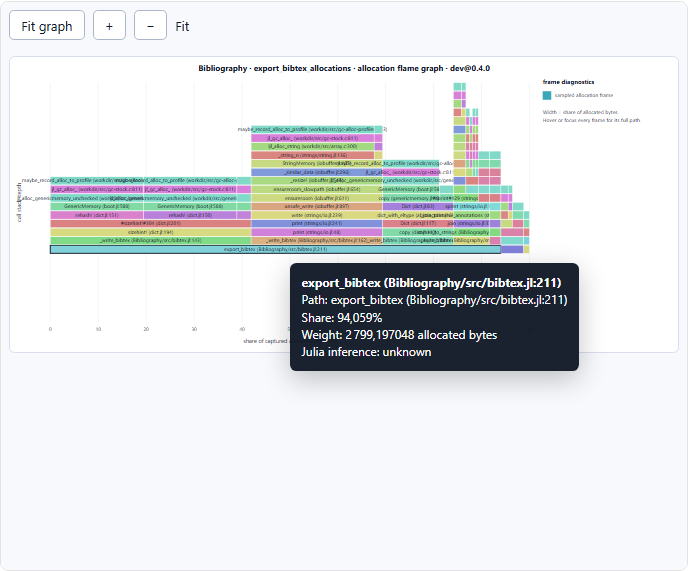
:profile_alloc — allocation stacks
Sampled allocation events with types and call stacks.
Bytes weight the amount; event counts weight the frequency. They can rank hotspots differently.
Julia-managed sampling does not cover native allocations.
Read qualification["allocation_profile"] together with the sites. An empty site table does not establish that the workload allocated nothing:
| Status | Interpretation |
|---|---|
complete | Target source sites were retained; inspect attribution counts and scope |
zero_allocations | The separate byte and allocation-count measurements were both zero |
no_samples | No allocation events were sampled; measured totals may still be positive |
outside_target_scope | Events were captured, but their source sites were outside the selected target |
unattributed_samples | Events were captured without a usable source site |
The record preserves measured total_bytes and total_allocations, raw and attributed sample counts, sample rate, repetitions, a message and weight semantics. Bytes and allocation count come from two independently prepared evaluations, rather than one common observation. Legacy profile plots distribute these measured totals over retained stacks; scenario profiles retain raw sampled weights. Keep those definitions distinct. Empty profiles retain their status and totals and do not produce invented source sites or a zero-valued flame graph. Scenario results also expose the independent whole-operation totals as separate observations, with independent_operation_total weight semantics and whole_operation scope. A successfully collected empty profile can belong to a functionally complete bundle; its qualification and diagnostics still determine what the profile supports. It does not establish a performance improvement.
CSV profile caches retain this qualification in a matching .csv.allocation-profile.toml sidecar. A legacy cache without it is recomputed instead of guessing what an empty table meant.
:alloc — allocation by source line
Allocation bytes attributed to file and line.
- Totals depend on collection scope and repetition; do not compare them with a per-call estimate.
Julia's line-allocation tracker creates source.jl.<worker-pid>.mem beside the sources it executes. PerfChecker records each worker's ownership before your preparation and measured code run. After success, a preparation or measurement error, or cancellation, it waits for the worker to stop and removes that worker's new traces. Files from other processes and unrelated .mem files are preserved. If a reused worker PID overwrites an existing trace, PerfChecker reads the new measurement and restores the previous bytes and permissions afterwards.
For asynchronous suites, call cancel_suite!(job) and then wait_suite(job); the cancellation request alone does not mean cleanup has finished. A cleanup failure is reported as a failure, including the retained private inventory directory, even when cancellation was requested. That directory contains the worker PID, known source roots and a journal including saved original trace bytes. If writing the inventory metadata also fails, that error is included in the failure and the already saved journal is retained. PerfChecker does not automatically delete old traces from earlier runs: inspect the reported paths and resolve the filesystem or process error first.
The inventory covers the worker environment, development dependencies, package depots, Julia standard libraries and files loaded through ordinary include. A direct include_string that invents a filename outside those roots is not covered by the include journal. A forcibly killed controller, power loss or repeated interruption that prevents its cleanup code from running can leave traces; no blanket deletion of a package's .mem files is performed on restart.
Network
:network— counters the workload reports. Safe to gate CI on those counters.:network_interface— shared host interface. Not CI-worthy unless the machine is hermetic.:network_isolated— dedicated network namespace. Safe to gate CI.
See Network measurement for attribution and which counts double on loopback.
One workload, several checks
Give several FeatureSpec entries the same workload identifier and different backends. Interfaces then group them under one operation and let the user pick the check type.
checks = [
    FeatureSpec(:import_bibtex_time; workload = :import_bibtex, backend = :benchmark, entrypoint = "features/import_bibtex.jl"),
    FeatureSpec(:import_bibtex_alloc; workload = :import_bibtex, backend = :profile_alloc, entrypoint = "features/import_bibtex.jl"),
]
The entrypoint is ordinary Julia and must return the same result for every target. Keep fixture construction outside the measured expression when setup is not part of the contract.
Choosing evidence
- Never compare values whose measurement-definition IDs or comparison keys are incompatible. See the measurement model.
Recorded examples