Plots, notebooks and Julia tools
Use saved evidence in full VS Code tabs, and run exploratory Julia code in an explicit notebook, terminal or debugger session. Studio links these surfaces without starting them on opening.
Plot saved results
Select a completed suite run in PerfChecker, then choose PerfChecker: Open visual output. The extension reads the saved suite report and opens available plots in an editor panel. Keep it beside the workload or use editor groups to compare reports. Native TestItems retain their separate JSON evidence in the PerfChecker test items output channel.
In the visual output, select Version series to compare recorded targets. Use the package, feature and check filters to narrow the evidence. Hover a point or focus its accessible button to inspect the value and unit. JSON and Series JSON open the underlying saved data when you need its provenance.
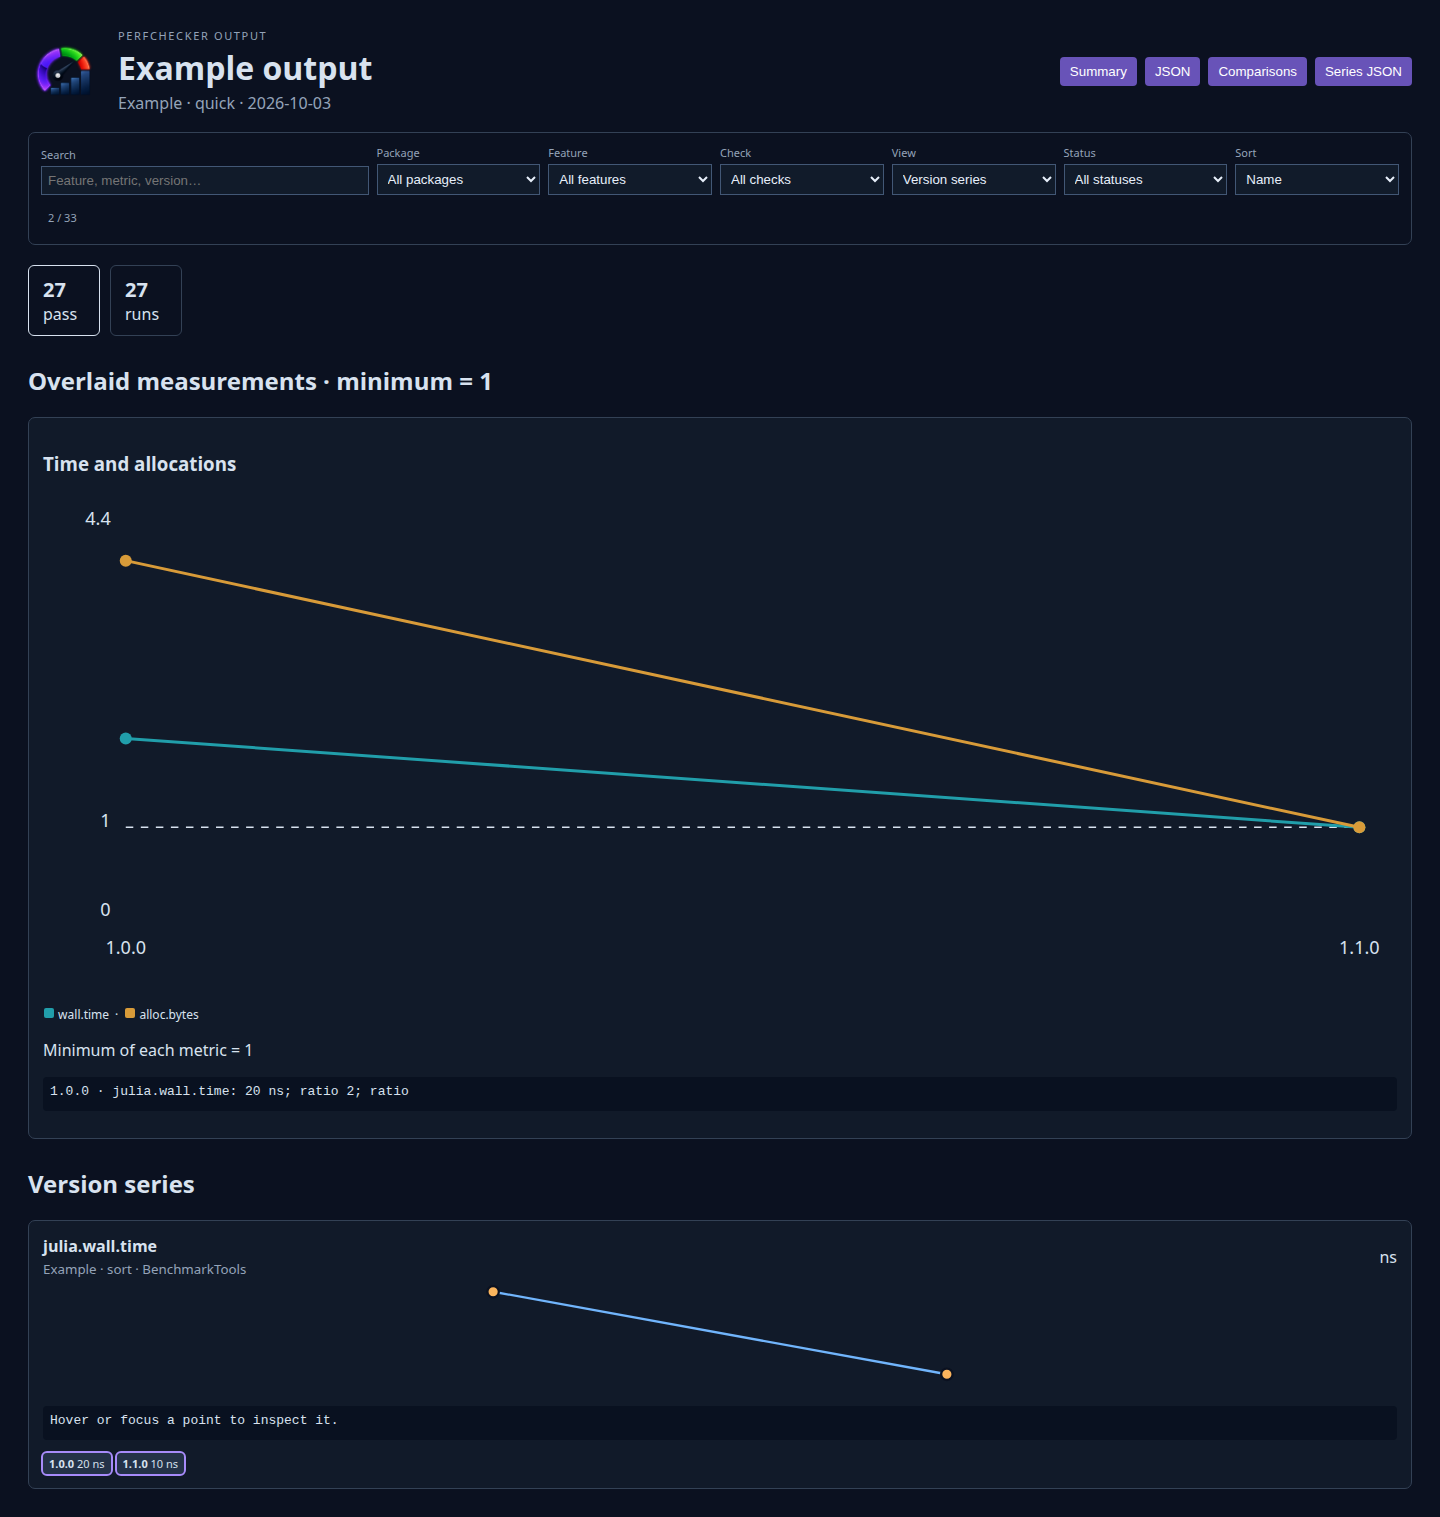
The normalized overlay makes different metrics readable together; a ratio of two for bytes and a ratio of two for time do not describe the same quantity. Select the corresponding raw series and compatible collector before drawing a conclusion. The screenshot's version labels belong to the demonstration package, not to PerfChecker's release version.
| Visual | Evidence needed | Interpretation |
|---|---|---|
| Distribution | Timing/allocation samples | Spread, outliers and sample count for the recorded configuration |
| Allocation view | Allocation samples or sites | Allocation activity, with units and sampling limits |
| Flame graph | Recorded profile stacks | Sampled call-path weights; not independent timing observations |
| Version comparison | Compatible target observations | Differences against the selected baseline and aggregation policy |
| Overlay | Comparable saved series | Contrast recorded configurations without inventing missing samples |
A report without profile stacks cannot produce a measured flame graph. A missing configuration remains unmeasured. Open worker output or source from the same run if a result is incomplete.
For custom Julia figures, load PerfCheckerMakie with your chosen Makie backend. The core notebook's display(bundle) presents a bundle; it does not automatically create every optional graphical backend. Save reports or create figures explicitly when you need reusable plots.
Investigation notebooks
PerfChecker: New investigation notebook opens an untitled notebook through VS Code's built-in jupyter-notebook document type. Select an available Julia kernel before running cells. Notebook support and a Julia kernel provider, typically Jupyter with IJulia, must already be configured. PerfChecker does not install either.
The generated notebook contains editable cells for activating the controller, discovering the workspace, loading the scenario catalogue and measuring in the target environment, then running JET diagnostics and displaying advice.
The main Julia calls are:
using Pkg
Pkg.activate(controller_project)
using PerfChecker

discovery = discover(root)
display(investigation_view(discovery))

catalog = load_scenario_catalog(catalog_path)
bundles = run_scenarios(catalog; project = target_project, samples = 10)
foreach(display, bundles)

diagnosis = diagnose(catalog; project = target_project, tools = [:jet])
advice = advise(diagnosis)
display(investigation_view(advice))
The generated cells fill in selected paths; the example uses explanatory variable names. Inspect the catalogue before executing measurement cells: they run all its declared cases. Proposed discovery candidates are not automatically adopted. Change the analyzer list or sample count to fit your experiment, and save the untitled notebook when you want to keep it.
JET must be installed in target_project. An unavailable analyzer is an explicit result; it does not establish that the program is free of inference problems.
PerfChecker: Open Julia notebook opens an existing .ipynb in the native notebook editor. A Pluto .jl notebook opens as Julia source; use PerfCheckerPluto for Pluto's reactive execution. PerfChecker does not convert between notebook formats.
Dedicated Julia terminal
PerfChecker: Open Julia terminal starts a terminal named PerfChecker · package-name with:
julia --startup-file=no --project=<resolved-controller-project> -iIts working directory is the selected package. The executable comes from perfchecker.juliaExecutable. A compatible existing PerfChecker terminal is reused; changing the project/executable creates a separately configured session.
Use it to inspect the public API or deliberately rerun a check. Interactive terminal state is independent from fresh measurement workers. Use saved bundle provenance for reproducibility rather than assuming the terminal matches a previous run.
Julia debugging
Install the Julia VS Code extension (julialang.language-julia) and open a saved Julia source file belonging to the selected package. Choose PerfChecker: Debug current Julia file. PerfChecker delegates to the Julia debug adapter with the selected scenario project and stops on entry.
Use deterministic advice to identify a workload or correctness failure.
Open its source and set a breakpoint.
Debug the file and inspect state, inputs and the oracle.
Finish debugging; rerun isolated correctness and performance checks.
Compare saved compatible results before adopting a change.
Debugger overhead and stepping change execution. Use debugging for correctness investigation, then collect performance evidence separately. Studio's Julia extension REPL action delegates to the Julia extension's own REPL, which keeps the environment selected in Julia's status bar; check it before running code. The dedicated PerfChecker terminal uses the selected controller project and remains a separate action.
Tasks and runners
Studio's tasks action opens VS Code's existing task runner. Opening Studio does not create tasks.json. Use established package tasks or the CLI for a repeatable invocation.
Suite target environments, scenario workers, native TestItems, notebooks and debug sessions serve different purposes. Select their environments explicitly. A system profiler also needs its platform/provider dependencies; see native profiling and native dependencies.
Etendu and live 3D companions
PerfChecker's public companion commands accept an explicit folder URI:
| Command | Contract |
|---|---|
perfchecker.openStudioForWorkspace(uri) | Open Studio for an existing workspace folder |
perfchecker.openDesignerForWorkspace(uri) | Open the suite designer for that folder |
perfchecker.runLandscapeLiveForWorkspace(uri, quality) | Run the existing live-landscape measurement workflow |
These command IDs are available to Etendu/Beautiful Landscape and other extensions. The URI must identify the intended folder in VS Code. The companion owns rendering, scene lifetime and its quality setting; PerfChecker owns the configured measurement invocation and saved evidence.
Before a live graphics comparison, keep the scene, quality, device and workload configuration comparable. A successful command or attractive scene does not establish a gain; retain the resulting evidence and its configuration.